Football data analyst and developerBraga, PortugalAvailable for work
I'm a football analyst and developer in Braga, looking for a job at a club or at a software company working in sports.
I've been a football fan my whole life, and more recently a basketball one too. The analytics part came from work: at Exeedme we built an analysis tool for professional CS2 teams, and that got me interested in what software like that could do. Put it next to the sports I already followed and the years I'd spent writing software, and the direction was obvious.
So I took a postgraduate degree in Big Data Applied to Football and finished it in 2025 with 95/100. Since then I've been building Pitchwatch, a public analytics platform for the Liga Portugal. Liga Portugal because I'm Portuguese and it's the league I know best.
Pitchwatch I built and run on my own, alongside a full-time job. Most of my working life has been on small teams though, so I'm comfortable either way. I'm open on what the day to day looks like.
Selected work
Pitchwatch
2026 to present
· Built and maintained solo, alongside full-time work
A public analytics platform for the Liga Portugal, covering seven seasons of event data. I do all of it: the ingestion, the models on top of it, and the match, team and player reports that make the output usable.
The ingestion pipeline holds 2.8 million events across 1,872 matches, reconciled from two independent providers by fuzzy entity matching. The matchday sync runs unattended, with backfills chained behind it and recovery for events that arrive incomplete.
An expected pass model that gives every pass a completion probability from its origin, destination, pass type qualifiers and game state. Validated on held-out matches, with calibration checked per pitch zone and separately for open play and set pieces rather than on one aggregate figure.
Role clustering that groups players by how they actually play, from touch locations and per 90 output rather than the position they are listed at. It surfaces players whose listed position hides what they contribute, the kind of mismatch a position filter misses in recruitment screening.
An expected points table from a double-Poisson model over match xG, separating results from underlying performance in the standings.
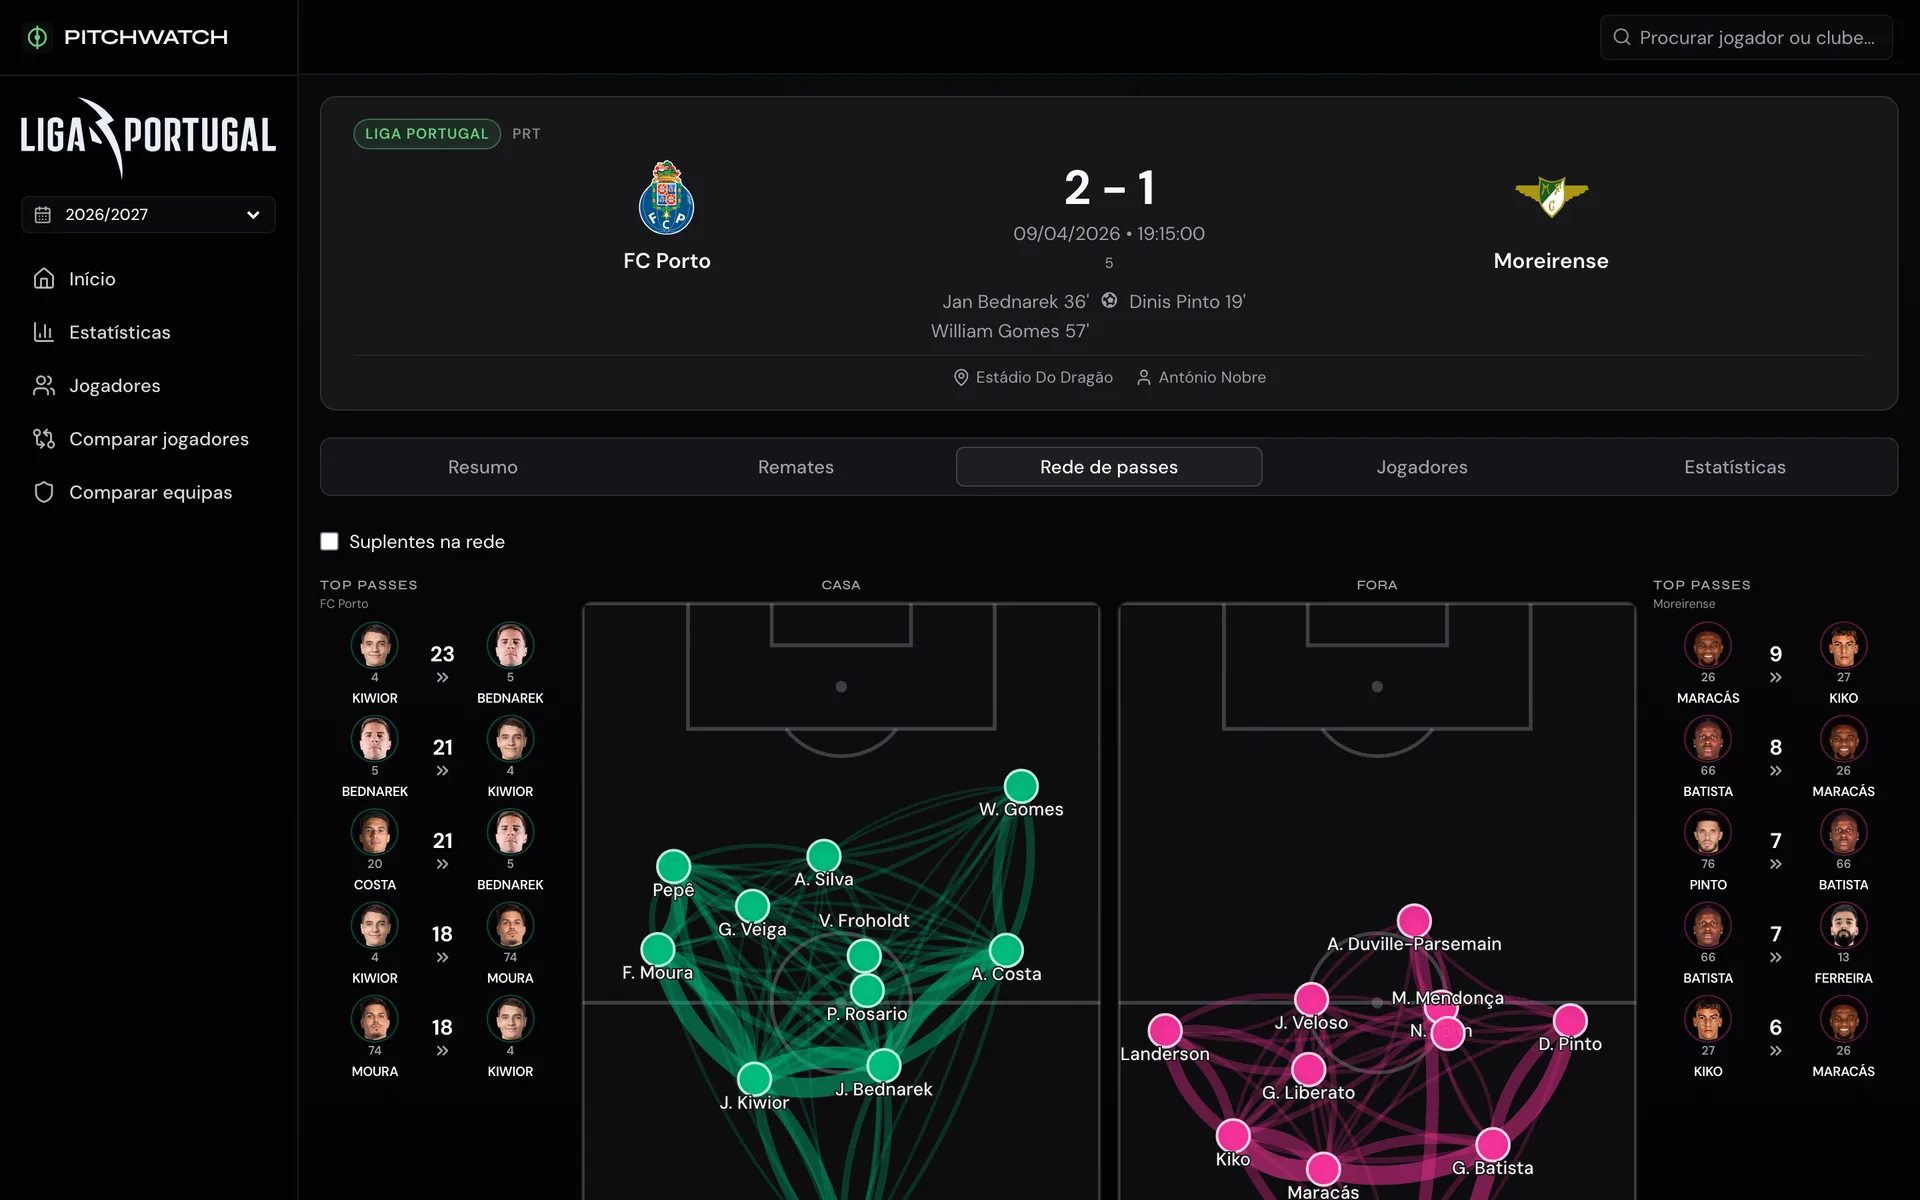
The analyst-facing output: match reports, player and team profiles, head to head, percentile charts against position and role peer groups, pass sonars, pass zone and box-entry maps, shot maps and similarity search.
Passing networks for both teams, average positions weighted by combination volume.
Tactical Versatility Index
2025
· Postgraduate final project, with Luís Simões and Vitor Lopes
A metric measuring how versatile a player is, from which of seven action types they complete successfully in each of six functional pitch zones, normalised per minute played and bounded between 0 and 1. Applied to Opta event data from the big five leagues and the Primeira Liga, 2024/25, and published as an open source Python package.
Each action type is weighted by the inverse of its 95th percentile rather than by z score, because the underlying actions are not normally distributed and rare ones like shots on target would otherwise count for almost nothing. We tested it against a Shannon entropy version of the same idea, to check whether versatility is better captured by the diversity of a player's actions or by how evenly they are spread across the pitch. Zones, action set and weights are all parameters, so it runs against other datasets.
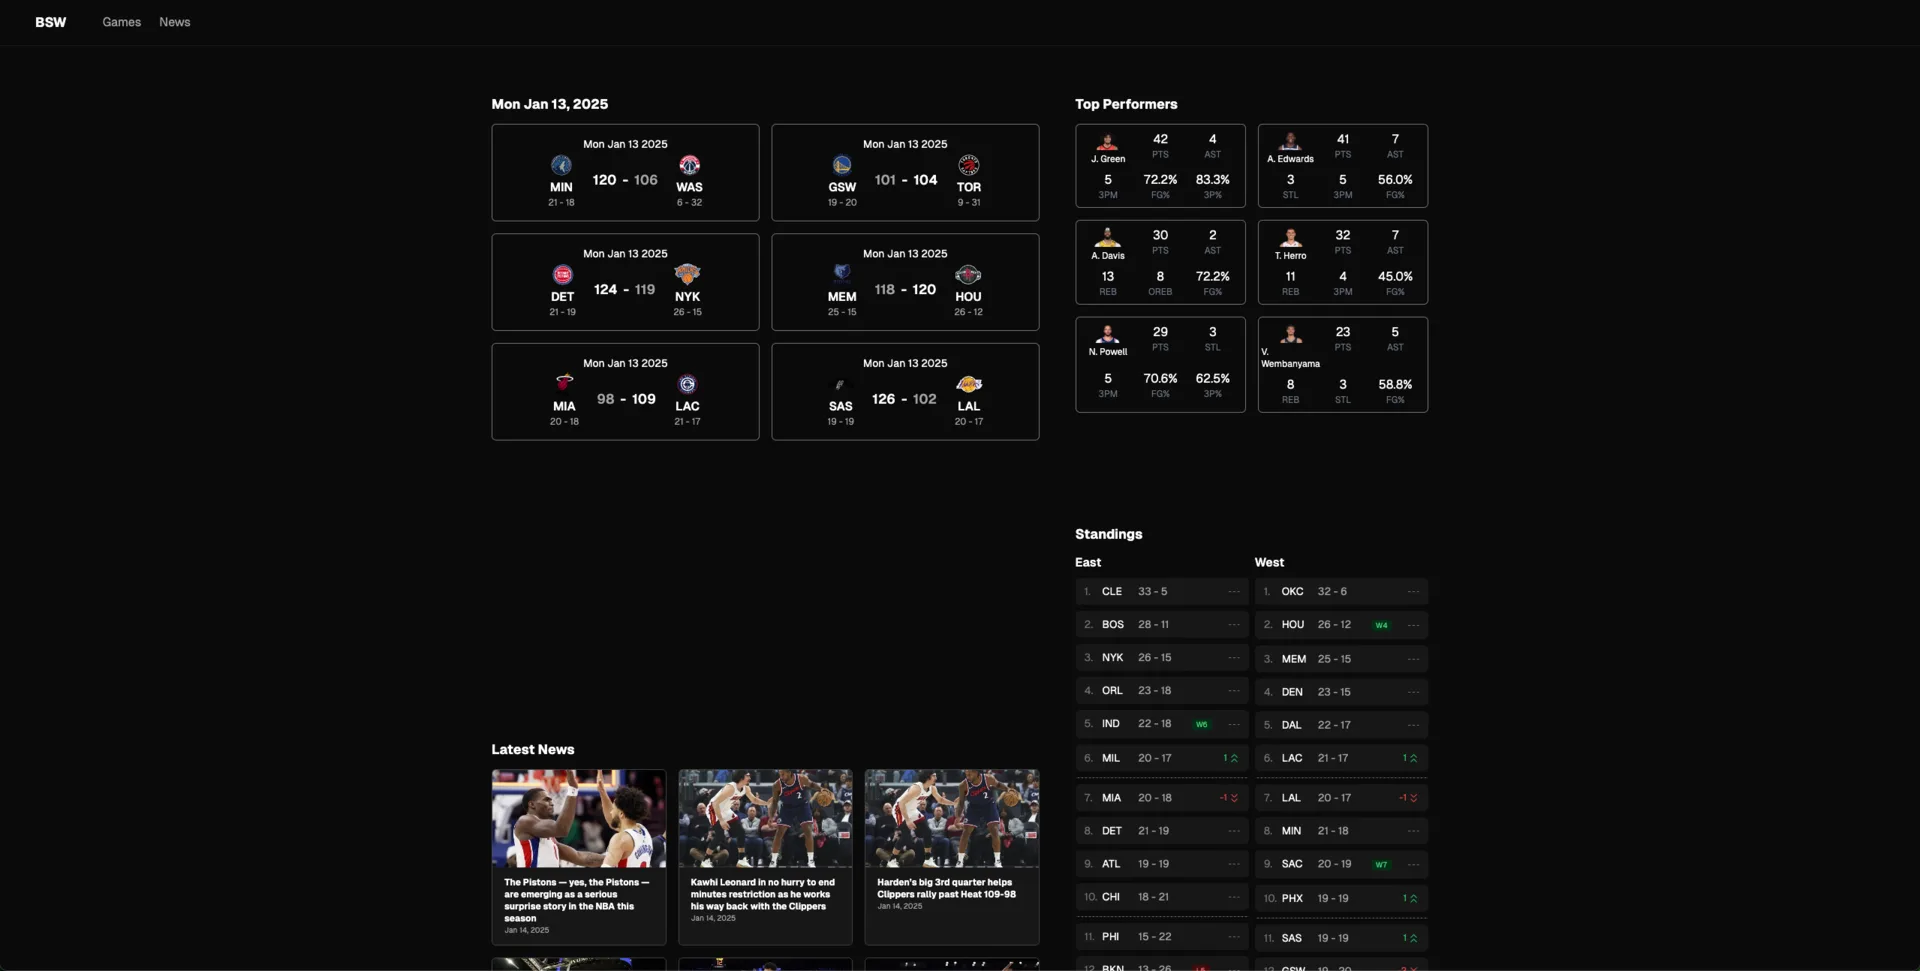
Game view, with the shot and scoring detail the box score leaves out.
SoccerStats
2024
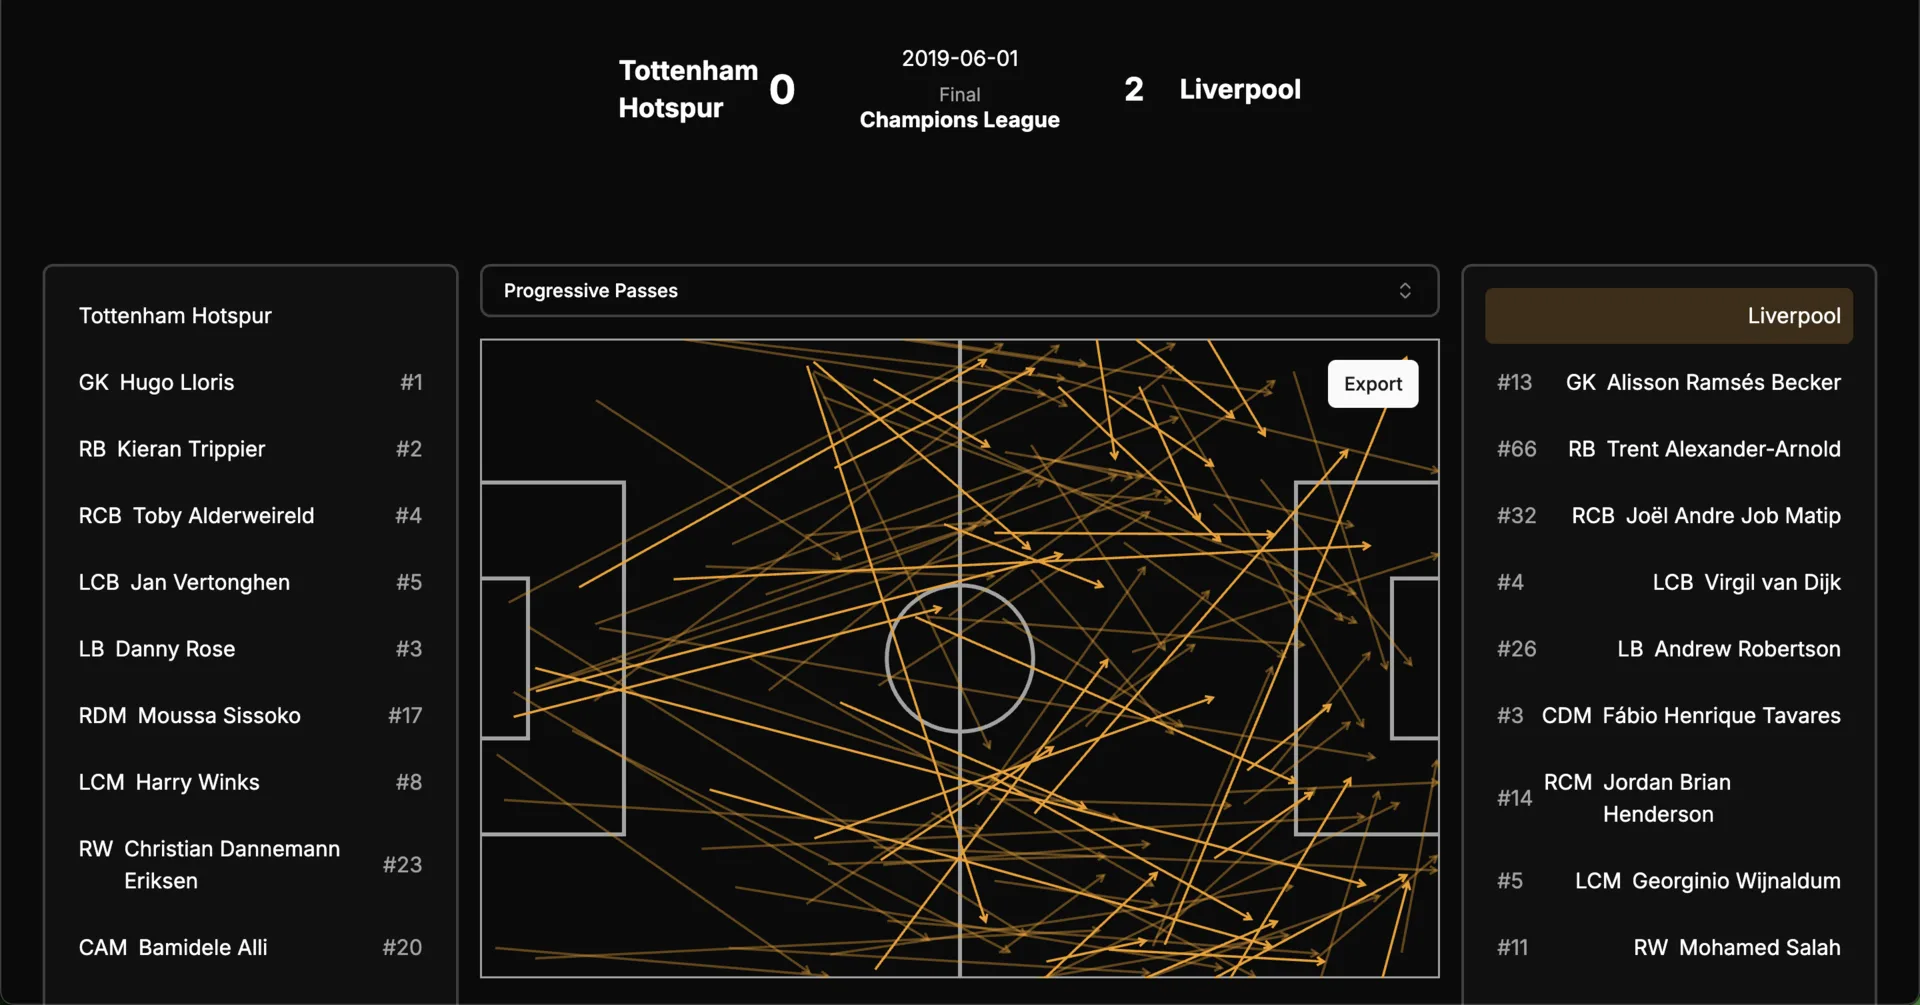
My first go at football match analysis, before the postgraduate degree. Explore match stats and export the visualisations as images. Pitchwatch is where all of this ended up.
One of three developers building and running the company's products, currently ggcase.com and skinsprotocol.com, both consumer platforms in the CS2 skins market handling real money transactions. I'm involved in each feature from the initial idea and architecture through to shipping it and keeping it running afterwards, across several products at once.
Built data visualisation components and automated data processing pipelines for a fintech analytics platform. Delivered features across the stack in Next.js and TypeScript, then worked on the backend migration to NestJS, with international clients in a distributed team.
Event data in Opta and StatsBomb schemas. xG and xGOT, expected pass, expected points, possession adjusted metrics, player similarity, role clustering.
Analysis and modelling
Python, pandas, NumPy, scikit-learn, LightGBM, SQL and PostgreSQL, model validation and calibration.
Data engineering
ETL pipelines, web scraping with Playwright, entity resolution, schema design, Docker.
Visualisation and tooling
Custom interactive dashboards, Plotly, Tableau, Power BI, TypeScript and React.